Original experiment footage is shared with the Japanese edition. Some on-screen labels are in Japanese; methods, results and video descriptions are provided in English below.
Could part of the trip from a harvesting area to a collection point be automated? TeamZ built a simulated orchard and small vehicle to test a roughly 90 m route, stopping and resuming for a crossing person, and stopping for a crate in the passage.
The purpose is to create an environment where we can change a condition and trace its effect on perception and control. We explain how we defined the route, observations, stop conditions and measurements.
The vehicle is an independently authored visual reference model, not a calibrated digital twin. Added sensors and driving control are TeamZ's virtual experiment. The vehicle runs empty; loading, unloading and payload performance are outside this test.
Stopping for a person and stopping for a crate use different methods
The official pretrained RT-DETRv4-S detector receives RGB images from the onboard camera. A person detected within the forward decision region triggers slowing and stopping; travel resumes after the person has passed. Person distance is estimated by projecting the bottom of the detection box onto an assumed flat ground plane.
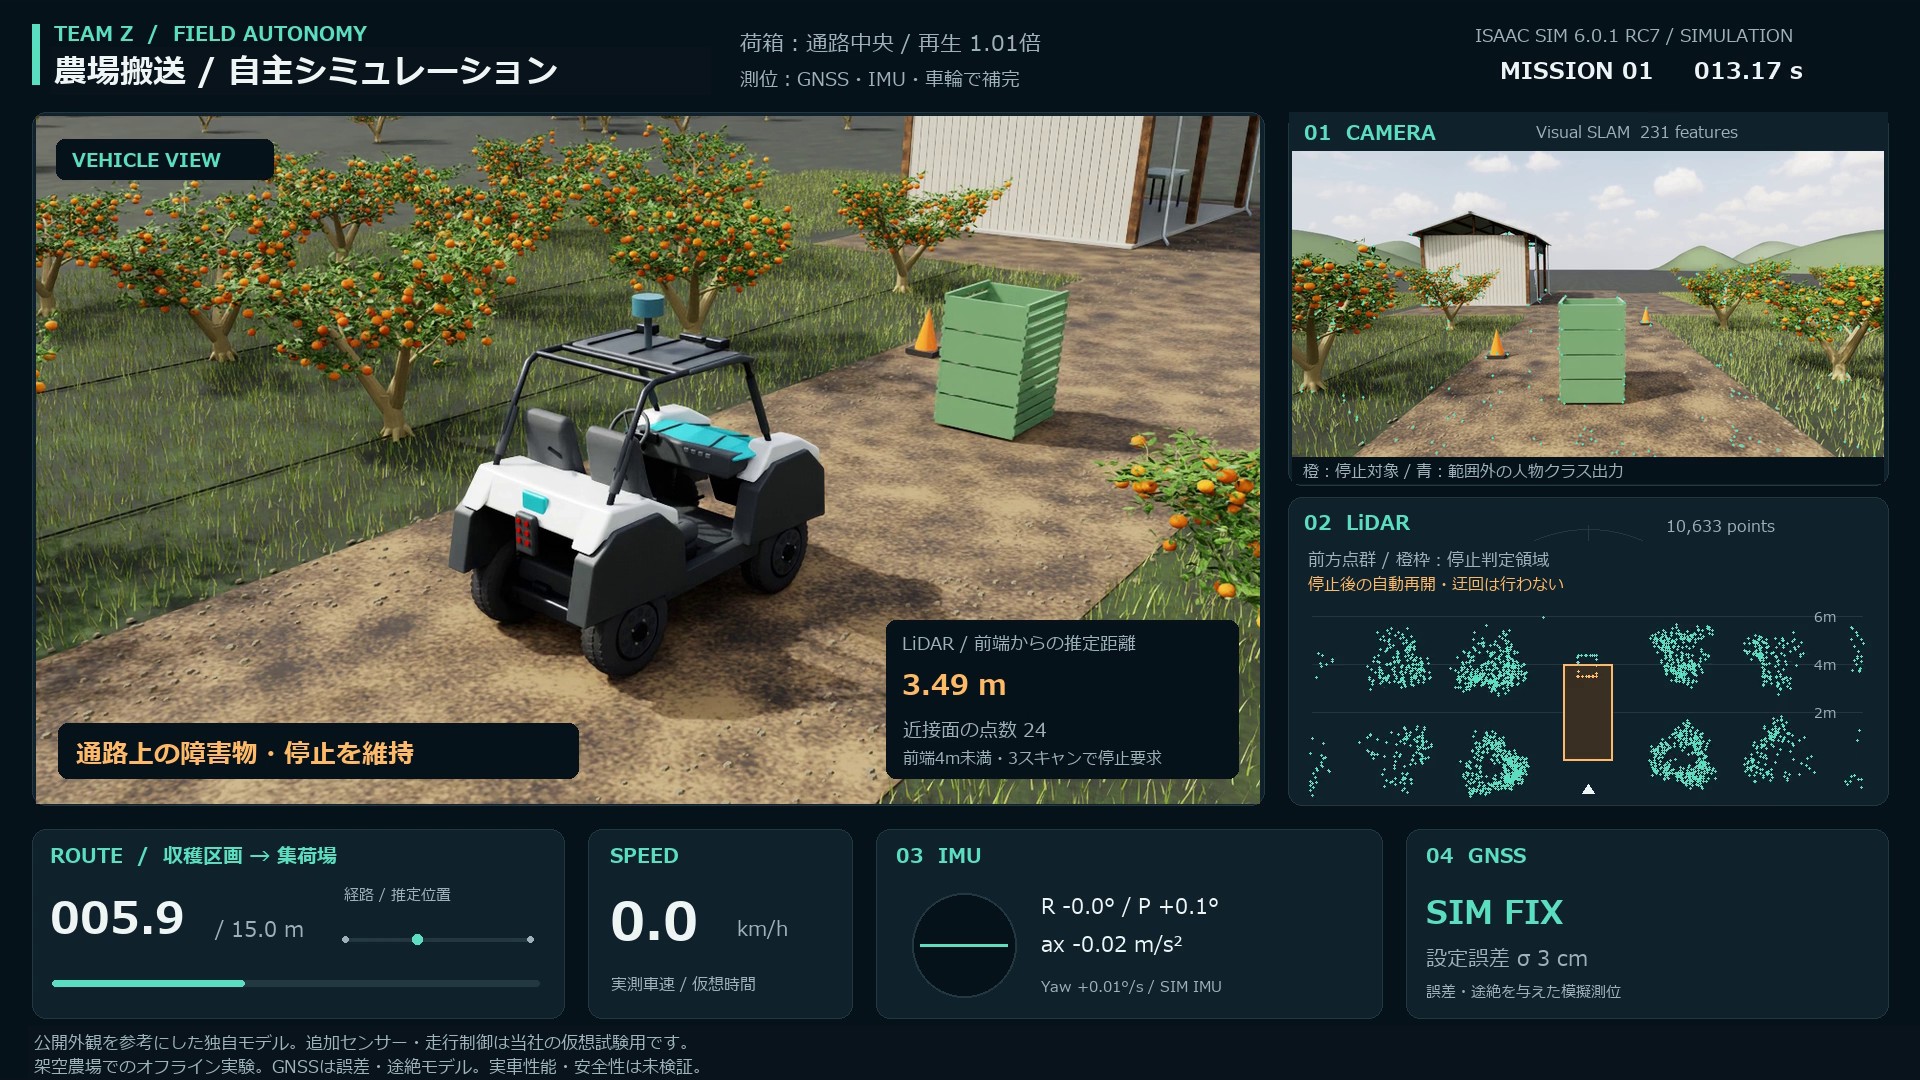
Crate stopping uses actual RTX LiDAR point-cloud output from Isaac Sim. Consecutive observations of elevated points inside a forward region trigger a stop request. The controller receives neither the crate's ground-truth coordinates nor a crate classification.
Person detection is the learned AI component. Stopping, resuming and path tracking use programmed control rules. We did not train an end-to-end driving policy or implement autonomous obstacle avoidance. The experiment connects observations and decisions to simulated wheel and steering joints.
Four sensor types, different roles
Knowing where the vehicle is and deciding whether the space ahead is clear are separate problems. Localization supports tracking a predefined route; person and obstacle detections supply stop decisions.
| Input | Role in this experiment | Implementation / assumption |
|---|---|---|
| Camera | Person detection and relative motion estimation | RT-DETRv4-S; cuVSLAM 17 using rendered stereo images |
| LiDAR | Obstacle stopping and point-cloud localization | Native RTX LiDAR output; registration updates rejected when quality is insufficient |
| IMU and wheels | Motion prediction | Simulated IMU readings and measured wheel-joint motion |
| Synthetic GNSS | Position corrections and outage testing | 10 Hz; independent 3 cm standard-deviation errors in each horizontal axis; prescribed 20 s outage |
These inputs are not always accepted with equal weight. Availability and consistency determine which updates are used. The long-route trials continued through a synthetic GNSS outage at simulation times 18–38 s. This measurement model does not reproduce satellite radio propagation, canopy multipath or RTK convergence.
Change a condition, then inspect the result
We kept the route, pedestrian motion and perception/control settings fixed and ran three conditions once each: standard lighting, low sun with long shadows, and a changed crate position. All three stopped for the crossing person, resumed and reached the collection point. Recorded travel was about 90.5 m, with a minimum person clearance of approximately 3.73–3.74 m, audited afterward using simulated geometry and motion logs.
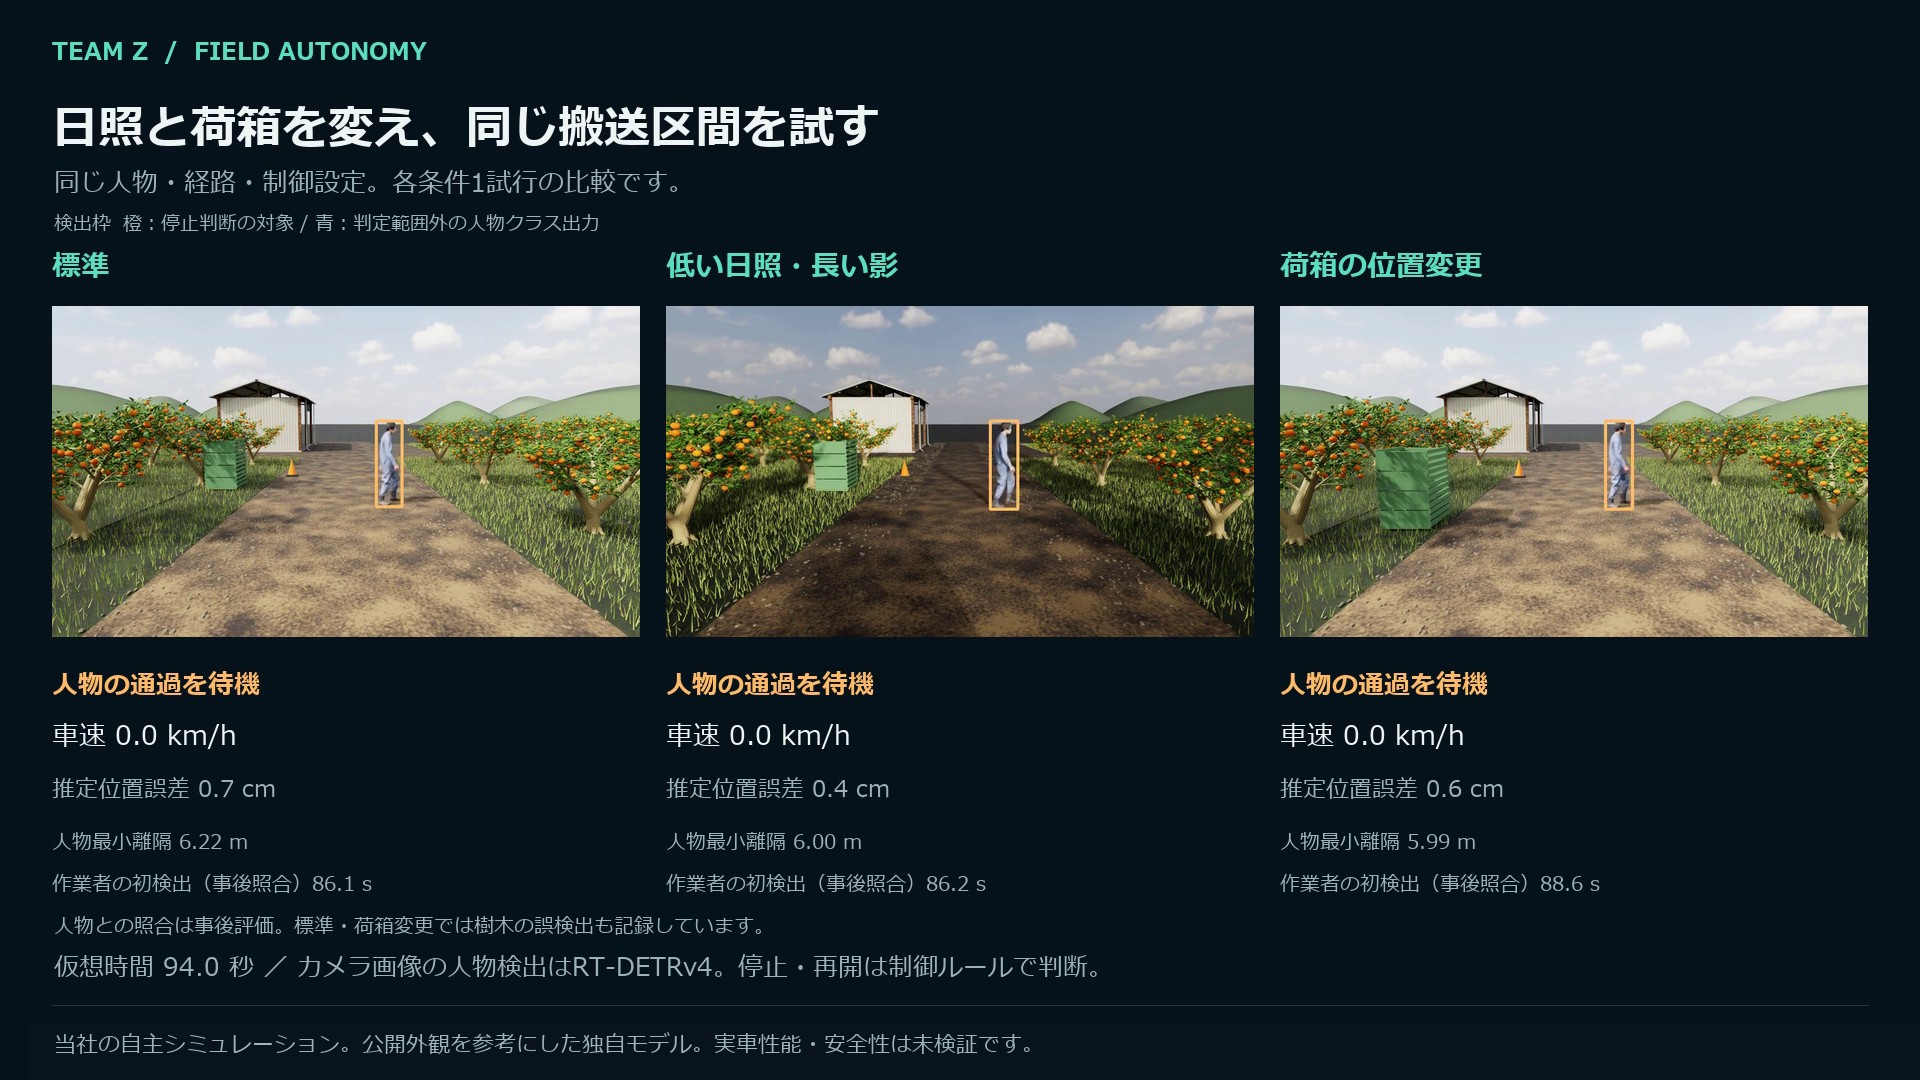
False detections remain. The standard and changed-crate trials each contain one accepted person-class output on a tree. The video's first person-class output therefore does not necessarily mean the first detection of the actual worker. Checking images against logs exposes what was detected incorrectly and whether it affected a stop decision.
A separate short-route pair changed only the crate's lateral position. With the crate beside the passage, the vehicle travelled about 15 m and arrived. With the crate in the passage, a LiDAR stop request was followed by speed falling below 0.03 m/s. Minimum crate clearance in that run was approximately 3.49 m. The vehicle remained stopped, without automatic restart or a detour.
How the research informed implementation
RT-DETRv4 transfers representations from a large vision model to a detector during training. We reviewed the October 8, 2026 revision and connected the official pretrained checkpoint, without additional TeamZ training. A separate small synthetic-image comparison did not establish an accuracy improvement for this application.
For localization, FAST-LIVGO informed the idea of combining LiDAR, images, IMU and GNSS. Our implementation is an independent simplified method, not a reproduction of that paper's estimator or performance.
What is needed before comparing with a real vehicle?
This environment lets us hold inputs fixed, introduce a change, and trace problems through perception, localization and control. A hardware comparison needs measured route geometry, surface and slope, sensor mounting, steering response and braking characteristics.
The initial data should include time-aligned camera, LiDAR, IMU and GNSS recordings, plus independently measured reference position, speed and stopping distance. Data collection responsibilities and measurement methods need to be agreed before defining simulation fidelity and comparison criteria.
The runtime was Isaac Sim 6.0.1-rc.7. The ground is flat and simulation time pauses during inference. Rain, fog, real-time processing delays and real-vehicle safety remain untested. The video's clearance figures are not demonstrated hardware stopping performance.
TeamZ develops simulation environments, integrates sensors with perception and control, and compares behaviour across conditions. If you have a route or operation you want to evaluate, discuss an implementation and evaluation project with us.
References and assets
Vehicle appearance reference: public C580 information. No manufacturer-supplied CAD or real-vehicle control interface was used. Added sensors and driving control do not represent the reference vehicle's standard features. The farm is fictional.
Person: ddd 142_Kei. Sky: Poly Haven / Farm Field Pure Sky (CC0, Dimitrios Savva and Jarod Guest). We publish our rendered footage, without distributing source models or textures.
LET’S BUILD TOGETHER
Turn your robotics ideas into questions we can test.
Tell us about your task, equipment and current challenges. Through simulation and tests on real robots, we explore feasibility and technical challenges together.
Discuss joint development